Gold key levels Mon, 19 Oct 2026
The XAUUSD levels published at 05:30 GMT on Mon, 19 Oct 2026, with that day's US news and how each level played out in the next session.
Day summary
Gold (XAUUSD) was at $4,175.42 at 05:30 GMT on Mon, 19 Oct 2026, up 0.23% from the previous close. The nearest level above was $4,188.10 (asia high), and the nearest below was $4,160.95 (asia low). There was no high-impact US news scheduled that day.
How these levels did: 3 held · 0 broke · 0 tested · 3 not reached.
- $4,147 PDLHeld
- $4,161 ALHeld
- $4,188 AHHeld
Gold is trading inside yesterday's range, $4,147 to $4,199.
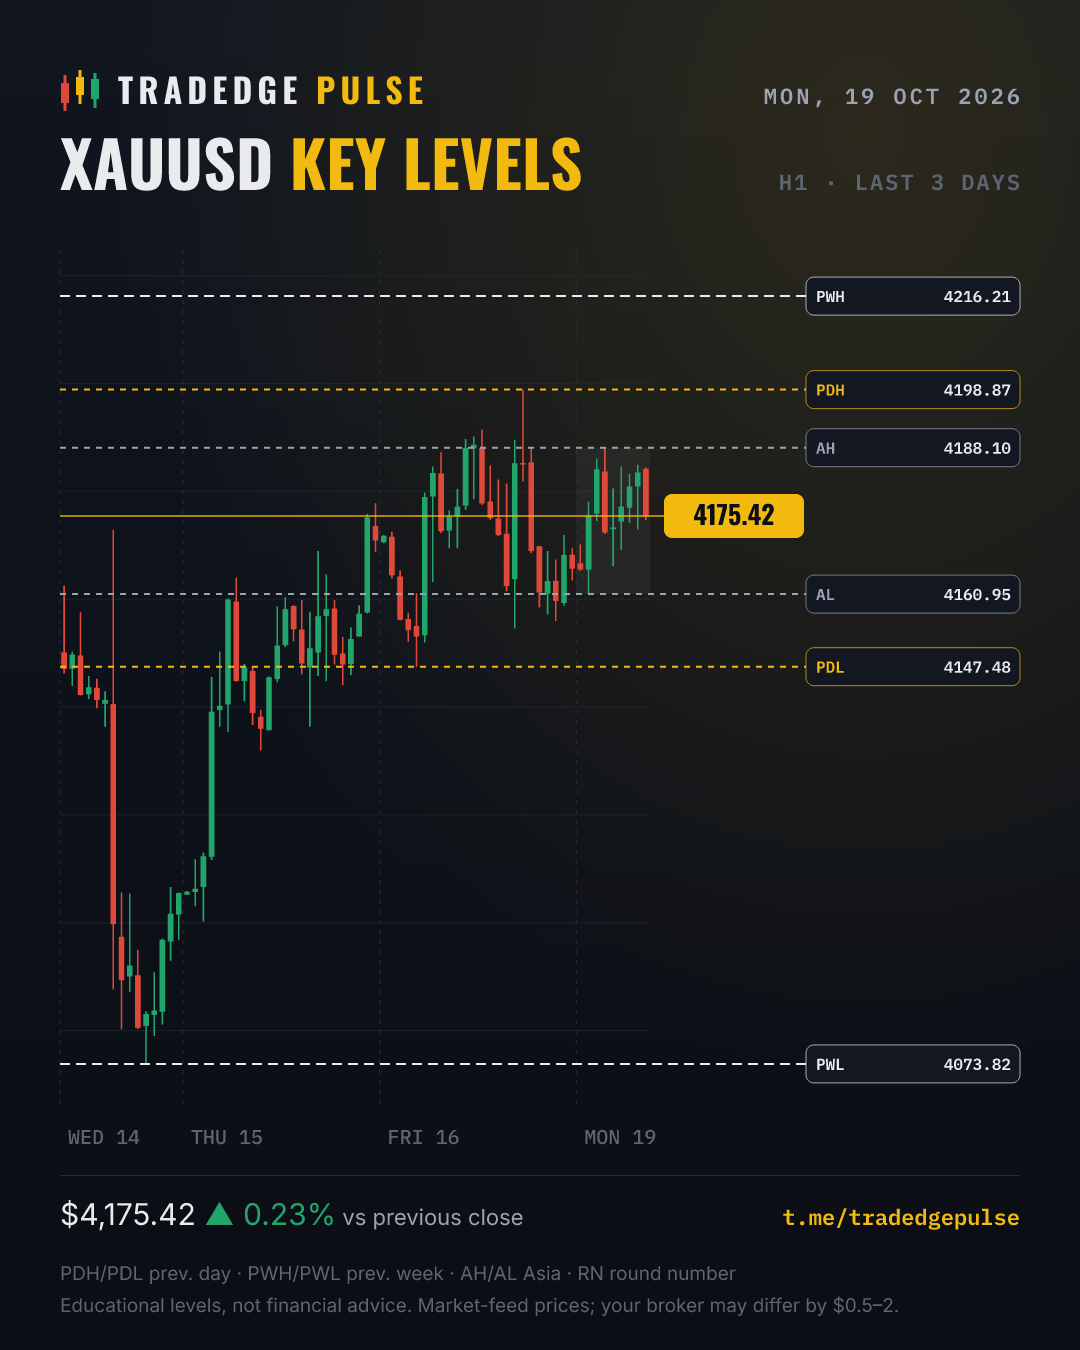
Above price
- $4,216.21Previous week high
- $4,198.87Previous day high
- $4,188.10Asia high
Below price
- $4,160.95Asia low
- $4,147.48Previous day low
- $4,073.82Previous week low
How yesterday's levels did
1 held · 2 broke · 0 tested · 4 not reached
- $4,150 RNBroke
- $4,164 AHHeld
- $4,173 PDHBroke
No Pulse zone near price today
The higher-timeframe imbalances our model is watching, each with a confluence rating, an invalidation price and targets. Yesterday's zones: 1 reacted · 0 broke · 0 tested · 1 not reached.
Track record
Every day's levels, scored against what price did next. Nothing is removed.
Scoring started Mon, 12 Oct 2026 · 13 days scored so far. Each day's levels are checked against the next session's price and added here automatically, wins and losses.
See every day in the archive →
| Day | Gold at 05:30 GMT | Levels | Pulse zones |
|---|---|---|---|
| Mon, 2 Nov 2026 | $3,906.54 | Scored next day | Scored next day |
| Fri, 30 Oct 2026 | $4,005.07 | 3 held · 1 broke · 0 tested · 4 not reached | None |
| Wed, 28 Oct 2026 | $4,035.37 | 4 held · 2 broke · 0 tested · 2 not reached | 2 reacted · 0 broke · 0 tested · 1 not reached |
| Tue, 27 Oct 2026 | $4,006.94 | 3 held · 2 broke · 0 tested · 2 not reached | 1 reacted · 0 broke · 0 tested · 0 not reached |
| Mon, 26 Oct 2026 | $4,014.93 | 1 held · 1 broke · 0 tested · 4 not reached | None reached |
| Fri, 23 Oct 2026 | $4,012.80 | 3 held · 1 broke · 0 tested · 4 not reached | None reached |
| Thu, 22 Oct 2026 | $4,086.31 | 4 held · 0 broke · 0 tested · 3 not reached | None |
| Wed, 21 Oct 2026 | $4,126.49 | 2 held · 2 broke · 0 tested · 4 not reached | None |
| Tue, 20 Oct 2026 | $4,133.04 | 2 held · 1 broke · 0 tested · 4 not reached | 2 reacted · 0 broke · 0 tested · 0 not reached |
| Mon, 19 Oct 2026 | $4,175.42 | 3 held · 0 broke · 0 tested · 3 not reached | None |
Run a website or blog? Embed today's levels for free; the box updates itself every weekday.
How these levels are chosen
Gold does not move between random prices. Large orders and stop losses cluster around a handful of obvious reference points, and those are the levels on this page.
Chart timeframe. The chart above shows the last 3 days on the 1-hour (H1) timeframe. The levels are daily, weekly and session reference points, so you can mark them on any chart you trade, from 5-minute to 4-hour.
Previous day high and low (PDH, PDL). Yesterday's extremes are where many intraday traders place stops. Price often runs just beyond them to fill those orders, then either continues or reverses. A clean break and hold above PDH, or below PDL, tells you the day is trending.
Previous week high and low (PWH, PWL). The same idea on a bigger scale. These attract swing traders and funds, so reactions there are usually larger.
Asia high and low (AH, AL). The range built during the quiet Asian session, before London opens at 07:00 GMT (08:00 GMT in winter). London often sweeps one side of this range in its first hours. See ICT killzones for gold for the session times.
Round numbers (RN). $50 steps such as 4,150 or 4,200 collect limit orders and options interest.
A level is an area, not a line: give it a few dollars either side, and size your position so the stop beyond it costs no more than you planned (our gold lot size calculator does the maths). Levels work best together with timing: high-impact US data can push through any level, so check the news times in IST first.
Our subscribers also get Pulse zones: the higher-timeframe imbalances the Tradedge Pulse model watches for a setup, with an invalidation price and targets for each. Every live trade the model takes is recorded on the live results page, losses included.
Questions
What timeframe is the key levels chart?
The chart shows the last 3 days of gold on the 1-hour (H1) timeframe. The levels themselves are daily, weekly and session reference points (previous day and week highs and lows, the Asian range and round numbers), so they work on any chart from 5-minute to 4-hour. Each level is scored the next day using hourly (H1) closes. The VIP Pulse zones come from the 4-hour and daily charts.
What time are the gold key levels updated?
Every weekday at 05:30 GMT, before the London session opens. The page and our free Telegram channel update at the same time. There is no update at weekends, when the gold market is closed.
How are these levels chosen?
They come from price itself, not opinion: the previous day's high and low, the previous week's high and low, the range of the Asian session so far, and the nearest $50 round numbers. These are the prices where many traders place orders and stops, so price often reacts around them.
What does "held" or "broke" mean in the track record?
A level held if price reached it and then moved at least $8 away on the same side without an hourly close through it. It broke if an hourly candle closed more than $2 beyond it. Tested means price touched it but neither happened, and not reached means price never got there.
What are Pulse zones?
Pulse zones are higher-timeframe imbalances that the Tradedge Pulse model watches for a setup, each with a confluence rating, an invalidation price and targets. They are areas to watch, not entries: the model only acts after a rejection and an M15 structure shift inside the zone. Pulse zones are for subscribers.
Why are your prices slightly different from my broker's?
Gold has no single exchange price. We use a market data feed; brokers stream their own quotes, which can differ by $0.50 to $2. Treat each level as a small area rather than an exact tick.
Are these levels financial advice?
No. They are educational reference prices that show where the market has been and where reactions often happen. They do not tell you to buy or sell. Trading gold on margin carries a high risk of losing money.
Educational reference levels, not financial advice. Prices come from a market data feed and can differ from your broker's by $0.50–2. Trading gold on margin carries a high risk of losing money.